- Click Dashboard, then click the Reports on the left screen session, reports interface screen will be shown as follow.
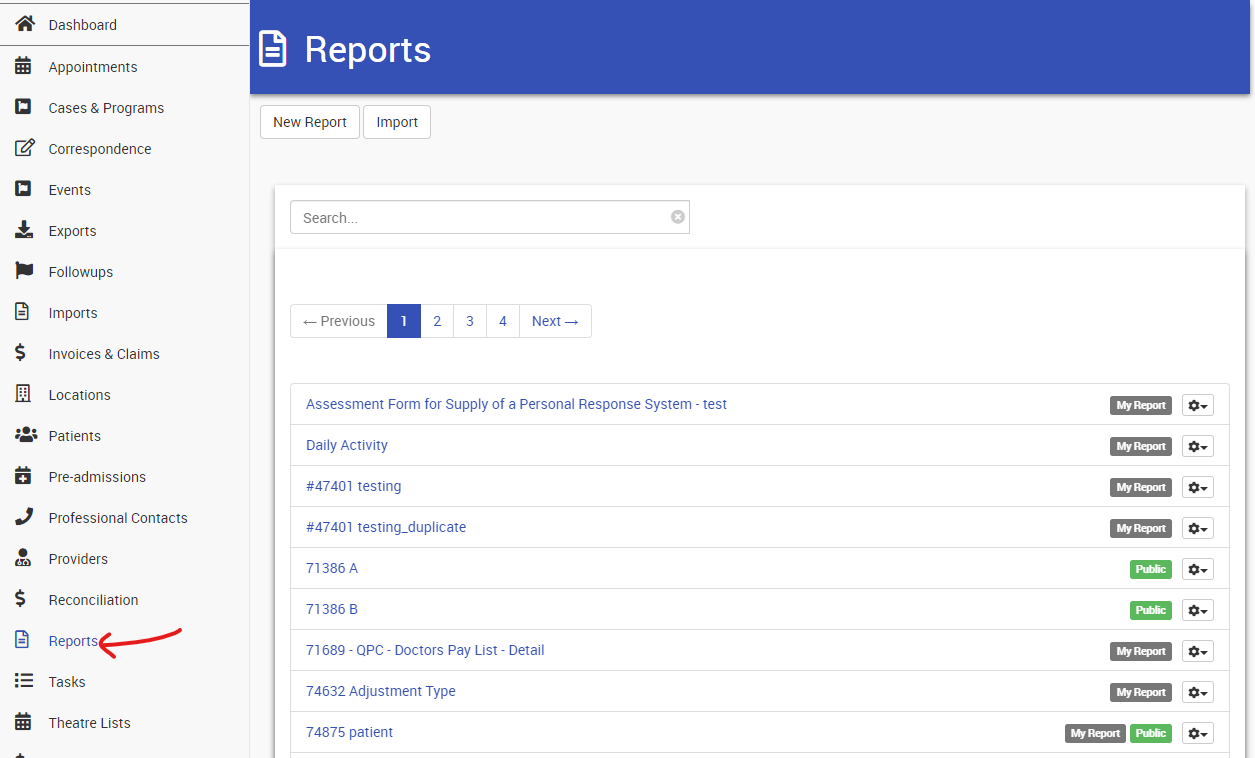
- On the Reports screen, click New Report.
- A list of all available reports appears — click on a report type. Available reports include::
- Admissions Report
- Appointment Report
- Assessment Report
- Audit Report
- Dataset Report
- Enquire Report
- Midnight Census Report
- Note Report


5. After you click the new reports, you can see the available fields

| Fields | Description |
| Sort Ascending | It will make data to be sorted as a increasing order |
| Sort Descending | It will make data to be sorted as a decreasing order |
| Group By | It will collect and categorize the same data into a group in the reports. For example, when you select group by for patient name, you will see all the information like invoices, notes and admissions done by the same patient name under this particular category. |
| Count | This will count the number of specific objects appear in the reports for user to navigate the quantity. For example, you can count how many invoices have been billed for the patients or how many admissions have been done by the providers. |
| Maximum | This will sort the data from biggest number to the smallest |
| Minimum | This will sort the data from smallest number to the biggest |
| Crosstab row heading | Only applicable to HTML or PDF output. Report will not generate correctly with this option and other formats selected. |
| Crosstab column heading | Only applicable to HTML or PDF output. Report will not generate correctly with this option and other formats selected. |
| Chart series | |
| Chart category |
6. Next to the scroll down selections, you can see columns of blanks. These blanks will let you input any numbers in it, and it will define the maximum threshold of particular selections. For example, if you type 1000 on the "Count" section, which means the count number will no longer be greater than 1000.

7. Some of the columns are considered as date, so an alternative options will be pop out, and you can choose the format of the date to be displayed in the reports depends on your preference.

Now, you have a choice, if you want to run this report daily or weekly, then it is a good idea to SAVE the report. This will save the settings. If this is a one off, then simply RUN the report.

To save a report:
- Scroll back up to the top of the report and give the report a useful name.
- Then scroll down to the bottom of the screen.
- To make the Report available to everyone, tick Public.
- Click Save.
- A save confirmation message appears and the report is left open.
- You will see the saved report in the My Reports list at the bottom of the screen.
To run a report:
- When the report settings screen loads, scroll down to the bottom of the screen.
- Click Run.
- If you choose not to save your report, you can run the Report as a one off:
- Build the report.
- Click RUN.
Depending on the type of report you requested, you will either see the report displayed on the screen (for HTML) or you will be able to view or download the report.
When a report is run, the author's name, creation date and last update date will display.

